The StackOverflow questions find which type of garbage collector is running, Default Garbage collector for a jvm, How can I see what garbage collector is running by looking at gc logs?, and How to know the current GC strategy of the HotSpot jvm?, and the blog post How to programmatically obtain GC information demonstrate the desire at times to know which Java garbage collector is used by a Java application. In this post, I look at some of the easiest and most common approaches to determining the garbage collector associated with a Java application running in the Oracle HotSpot VM.
For demonstration purposes, I'll be running a simple Java application. The code for this application is not significant for demonstrating how to determine the applicable garbage collector. The simple Java application can be run with the command java -cp stringInstantiationsDemo.jar dustin.examples.demo.IndefiniteRun. Notice that there is no specification of a JVM flag for the garbage collector to be used. This means that the JVM will use an ergonomically selected garbage collector.
One easy approach to determining the selected garbage collector is via use of the -XX:+PrintCommandLineFlags flag (which I wrote about in the blog post JavaOne 2011: The Definitive Set of HotSpot Performance Command-line Options). This flag can be used in the command java -XX:+PrintCommandLineFlags -cp stringInstantiationsDemo.jar dustin.examples.demo.IndefiniteRun as demonstrated in the following screen snapshot:

As the last screen snapshot indicates, use of the -XX:+PrintCommandLineFlags demonstrates the existence of the -XX:+UseParallelGC flag, which indicates that the collector being used automatically in this case is the parallel collector (also known as throughput collector).
Use of the -XX:+PrintCommandLineFlags allows us to see the ergonomically selected garbage collector works well when starting a new Java application. When we want to see the garbage collector used by an already-running Java process, jcmd comes in handy (I wrote about this useful tool in the post jcmd: One JDK Command-Line Tool to Rule Them All). This is illustrated in the next screen snapshot that demonstrates use of jcmd to see the JVM command-line flags of an already-running Java application.

From the previous image, we see that we can use jcmd <pid> VM.flags to identify virtual machine flags that will indicate the garbage collector being used. In this case, we again see the presence of -XX:+UseParallelGC, indicating use of the parallel/throughput garbage collector.
I just demonstrated using jcmd to see the implicit JVM arguments that tell us which garbage collector was automatically chosen for a particular application's VM when the garbage collector was not explicitly specified. The next two images show that JConsole and VisualVM do NOT show implicit JVM arguments and so do NOT show the garbage collector being used automatically when one is not specified.


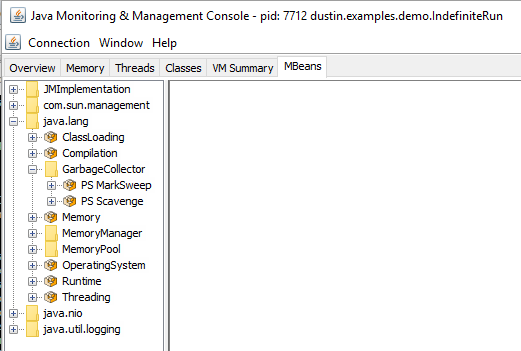
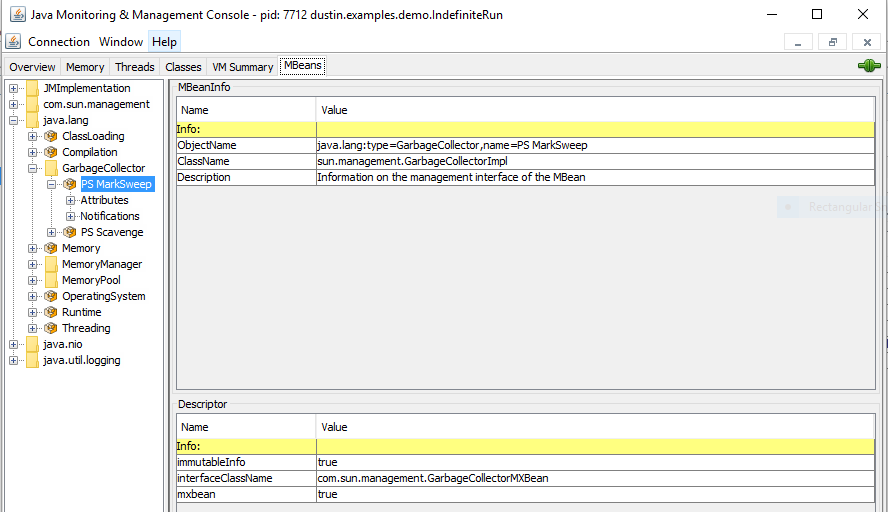
Although neither JConsole nor VisualVM shows implicit Java Virtual Machine arguments such as the implicitly chosen garbage collector, both tools can still be used to determine the garbage collector in use via JMX and the GarbageCollectorMXBean with object type java.lang:type=GarbageCollector. In the case of the simple application used so far in this post, this will be java.lang:type=GarbageCollector,name=PS MarkSweep because this is the parallel or throughput collector. This is demonstrated in JConsole and VisualVM (via the MBeans plugin) in the next two screen snapshots.
The above examples have demonstrated three basic approaches to determining which garbage collector is applicable. These are summarized in the following table for the parallel/throughput collector previously demonstrated as well as for the other two main Oracle HotSpot JVM collectors (CMS and G1). The table shows what to look for when ascertaining which collector (parallel, CMS, or G1) is in use with one of the approaches described above (explicitly specified on command-line, jcmd, or JMX MXBean).
| Garbage Collector | Explicit Command-line | jcmd VM.flags | java.lang:type=GarbageCollector,name= |
|---|---|---|---|
| Parallel / Throughput | -XX:+UseParallelOldGC-XX:+UseParallelGC |
PS MarkSweep PS Scavenge |
|
| Concurrent Mark Sweep (CMS) | -XX:+UseConcMarkSweepGC |
ConcurrentMarkSweep | |
| Garbage First (G1) | -XX:+UseG1GC |
G1 Old Generation G1 Young Generation |
|
Although not shown here, another way to determine which collector is in use from VisualVM or JConsole is to use the DiagnosticCommandMBean to look up VM.flags in the same manner that jcmd provides VM flags as discussed above. I have blogged on using DiagnosticCommandMBean to accomplish jcmd behaviors in the post Looking at DiagnosticCommandMBean in JConsole and VisualVM.
The JVM generally prevents two different garbage collectors' flags from being provided. When two exist on the same attempt to launch a Java application, a message like "Conflicting collector combinations in option list" will appear and the Java process won't start. Therefore, one simply needs to identify a flag for a specific collector associated with a running Java application to know which collector is in use. This post has demonstrated multiple simple approaches that can be used to identify which HotSpot garbage collector is being applied in a given application's JVM.
No comments:
Post a Comment